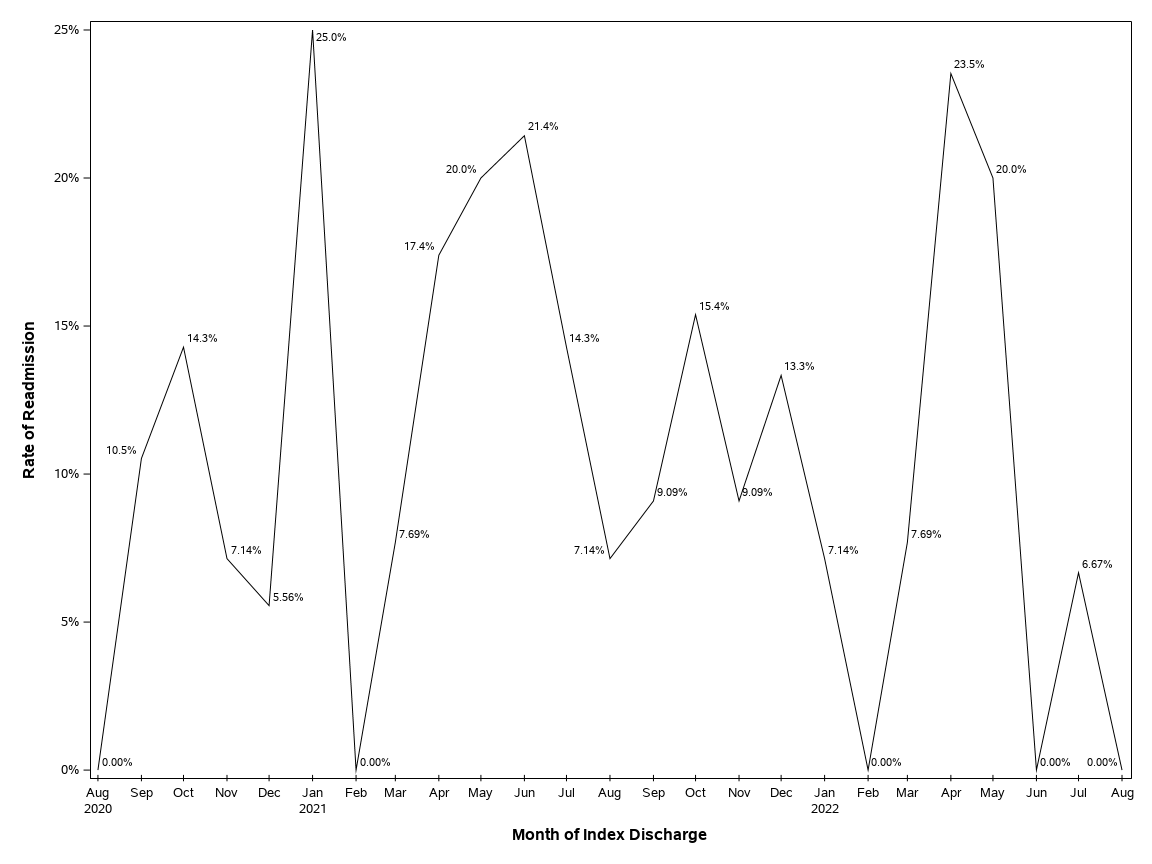
| All Cause 30-Day All Cause Readmissions |
| THHBM Monthly Rates Ages 65 and older |
| All Cause 30-Day All Cause Readmissions |
| THHBM Monthly Rates Ages 65 and older |
| Fiscal Year | FYTD | July | August | September | October | November | December | January | February | March | April | May | June |
|---|---|---|---|---|---|---|---|---|---|---|---|---|---|
| FY2021 | 11.3% (22/194) |
10.7% (3/28) |
0.00% (0/16) |
10.5% (2/19) |
14.3% (2/14) |
7.14% (1/14) |
5.56% (1/18) |
25.0% (3/12) |
0.00% (0/13) |
7.69% (1/13) |
17.4% (4/23) |
20.0% (2/10) |
21.4% (3/14) |
| FY2022 | 10.7% (19/178) |
14.3% (2/14) |
7.14% (1/14) |
9.09% (2/22) |
15.4% (2/13) |
9.09% (1/11) |
13.3% (2/15) |
7.14% (1/14) |
0.00% (0/14) |
7.69% (1/13) |
23.5% (4/17) |
20.0% (3/15) |
0.00% (0/16) |
| FY2023 | 4.00% (1/25) |
6.67% (1/15) |
0.00% (0/10) |
| Patient List - Most Recent 3 Months |
| Medical Record Number | BSWQA Member |
EPIC CSN ID | Index Account Number | Index Discharge Date |
Readmission Date | Readmitting Facility |
Days Between Index and Readmission |
|---|---|---|---|---|---|---|---|
| 7615908 | 0 | . | 65000383680 | 08MAY2022 | 13MAY2022 | MCK | 5 |
| 7786971 | 0 | . | 65000387525 | 11MAY2022 | 14MAY2022 | MCK | 3 |
| 2075682 | 0 | . | 65000397130 | 31MAY2022 | 06JUN2022 | MCK | 6 |
| 8402204 | 0 | . | 65000433126 | 15JUL2022 | 17JUL2022 | MCK | 2 |
Twenty-Four Month Readmission Detail File - All Ages: Twenty-Four Month Readmission Detail File - All Ages |
Readmission ED High Utilization File - All Ages: Readmission ED High Utilization File - All Ages |
Dashboard Last Updated: August 15, 2022 |